Results

Expected results

The relevance of this project is supported by its interdisciplinary and multidisciplinary character, as well as scientific and academic potential impact of the chosen theme. Firstly, temporal correction factors correlated with the building type (residential and workplace) and especially with MLI-AIRC will decisively contribute to improving the accuracy of the AIRC assessment of indoor radon concentration which will lead to accurate decision making. Concerning the scientific impact, the study will highlight new ideas by filling crucial gaps in the existing methodology for annual radon concentration assessment. Consequently, the impact of the project has the potential to bring the necessary scientific evidence to make an update to EC Directive 2013/59/Euratom. The originality of the proposed project will be attained using the complementary measurements as a surrogate for the seasonal variability of the radon concentration, thus resulting in a reduction of the uncertainty associated with TCF. Secondly, as a result of continuous measurements of radon in the soil gas, along with environmental parameters, the modelling of their variations over time will generate the necessary basis for the application of new projects in the direction of current international concerns, such as the use of radon as a precursor of earthquakes. 


It aims to achieve the following innovative scientific results of national and international scientific interest: 1). A methodology for defining MLI-AIRC with the indication of the factors necessary to be monitored at the same time as radon to increase estimation accuracy – 1 Q1 article; 2). A database with TCF monitored in residential buildings and workplaces, by continuous and integrated methods – 1 Q2 article; 3). Correlation of the results provided by continuous indoor radon measurements with those obtained in the soil gas and of the exhalation rate, considering the impact of environmental parameters – 1 Q1 article; 4). An interactive mobile application for informing the participants about the measurements performed and radon risk awareness; 5). Guides with recommendations for potential beneficiaries on indoor radon exposure. Overall, our target is to publish the project results in form of 2 scientific articles in Q1 specialized journals and one article in Q2.

At the same time, the expansion of the collaboration area in related fields such as environmental monitoring, modeling in the field of environmental pollution or seismology is being pursued.


Obtained results

Summary – real vs. overall radon exposure

The study concerned 34 residential buildings, of which 25 from Cluj-Napoca, 7 from Timişoara and two from Bucharest. All public/workplace buildings (n = 35) were selected from Cluj-Napoca. In the case of residential buildings, 32 are single-family houses, and two are apartment blocks, one of the apartments being located on the ground floor and the other on the 4th floor. In the case of the public/workplace buildings, 12 were represented by educational and research institutions, 14 private offices, 6 medical offices, 2 hospitals and a residence hall.

The average annual radon concentration in residential buildings was 252 Bq/m3, ranging from 21 to 655 Bq/m3. The mean value (121 Bq/m3) calculated for the public/workplace buildings is the same as the value published by Cosma et al. (2013) for Cluj County, where the buildings in question are situated. The educational and research institutions exhibit the greatest average radon concentration (166 Bq/m3), with the maximum mean (761 Bq/m3) found in a classroom among all public and workplace buildings. The lowest average recorded by the AIRC is specifically for medical offices, measuring 68 Bq/m3.


For workplace buildings, 80% of the participants reported that their work hours are between 8 A.M. and 6 P.M. Therefore, using the data obtained from the ICA device, it was possible to calculate the actual level of exposure to radon concentration, while considering the specified duration of occupancy. The relative percentage difference (RPD) between the medians reaches -17% (62 Bq/m3 vs. 75 Bq/m3), p < .001, indicating a significantly lower exposure for the hours in which the real exposure takes place compared to the situation in which the exposure is calculated for the entire period.


In 50% of residential buildings, the declared period of occupancy includes exposure during the night (from 8 P.M. to 7 A.M.). In these cases, the radon concentration (Med. = 278 Bq/m3) is significantly higher than the overall computed concentration (Med. = 245 Bq/m3), with a p-value of .02. The DPR between medians is 13%.

Summary – temporal correction factors (TCF)

The following figures show TCF from the perspective of the month when radon measurement start, respectively its duration depending on the type of monitored building. Both in the case of residential buildings (Figure 1) and those with workplaces (Figure 2), the TCF variations are shown for the situation where the duration of the measurements is 3 and 6 months respectively (upper graph), respectively depending on the start of measurement: June, respectively September (right graph). As expected, a much greater variability is specific to measurements lasting 3 months, the maxima being specific to the warm season. In the case of 6-month measurements, the maximum values ​​are specific to the period March – May, the weight of the summer months being felt more strongly in the calculated values. Much less variability for TCF is observed for buildings with workplaces.

Figure 2. Temporal correction factors depending on the starting month and duration of the measurement according to the type of building (workplace buildings)

Figure 1. Temporal correction factors depending on the starting month and duration of the measurement according to the type of building (residential)

For the case where the measurement starts with a month specific to the warm season (June), a high variability is specific to short-term measurements (up to 3 months), since only after the 5-month period do the TCFs specific to residential buildings converge to the value 1, being close to those in the workplace buildings, an aspect also confirmed by RPD < 25%. In the situation where the starting month is September, the DPR is lower than the 25% threshold. The results indicate that the application of TCF specific to residential buildings, to those with workplaces can lead to erroneous estimates of AIRC even if the measurement duration is 6 months. Obviously, the data must be viewed with caution considering the fact that the assessment concerned several slices specific to the TCF „tomography”.

As such, TCF elaborated on residential buildings and contained by Romanian legislation cannot also be applied to public/workplaces buildings and in certain situations, for example in the case of the warm season, they are not specific to residential buildings either. Thus, it is necessary to find some methods for determining an interval attached to the calculated radon concentration, which presents a high probability of containing the annual average and which is specific to both the measurement method and the type of building where the measurement takes place.

Summary – A methodology for defining MLI-AIRC  to increase estimation accuracy

The current worry lies in the attractiveness of conducting short-term radon assessments to determine the required corrective actions for high annual concentrations, which carries significant economic repercussions. Measuring annual radon concentrations in indoor air necessitates collecting data across several months, which can be challenging to handle in the area of construction due to the associated delays.

Reducing the length of time for radon measurement necessitates the incorporation of correction factors (Uv) that align with the duration of the measurement. The selected approach in this matter was the Most Likely Intervals (MLI) identifying method. The distinction between Most Likely Intervals (MLIs) and confidence intervals lies in their intended function and interpretation within the decision-making process when faced with uncertain conditions. According to this method, the correction applied for measures lasting a few days ranges from 1.78 (one day) to 1.16 (for 21 days). For measurements lasting 3 months, the correction value is 0.75, while measurements lasting 6 months result in a correction of 0.58.

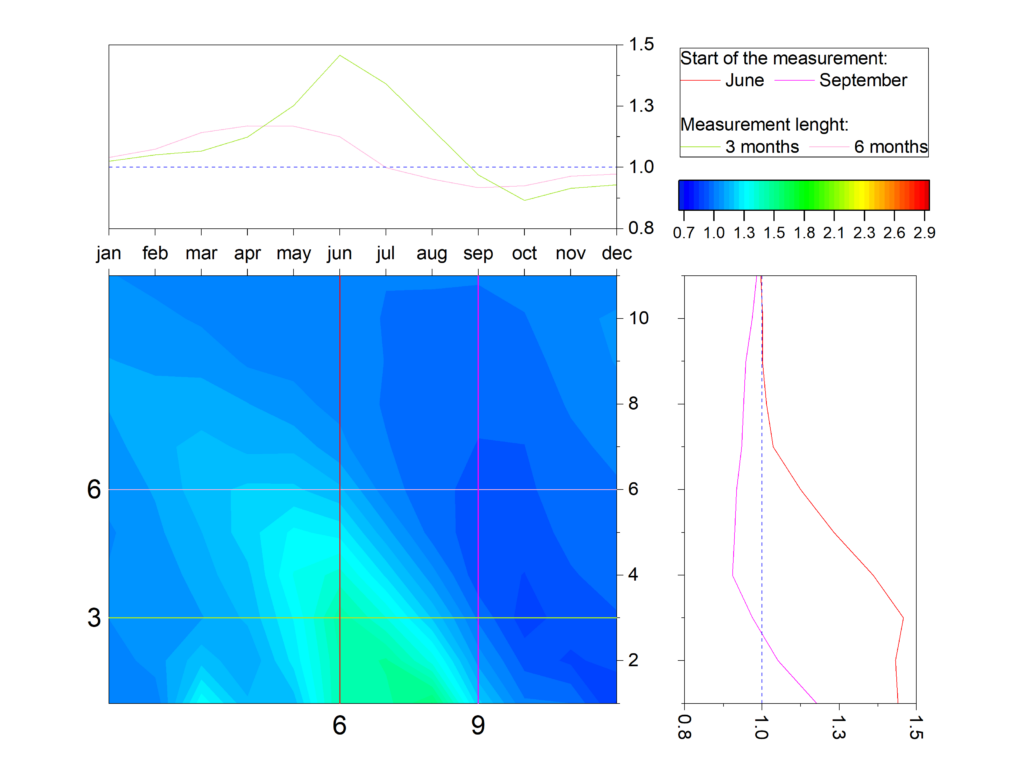
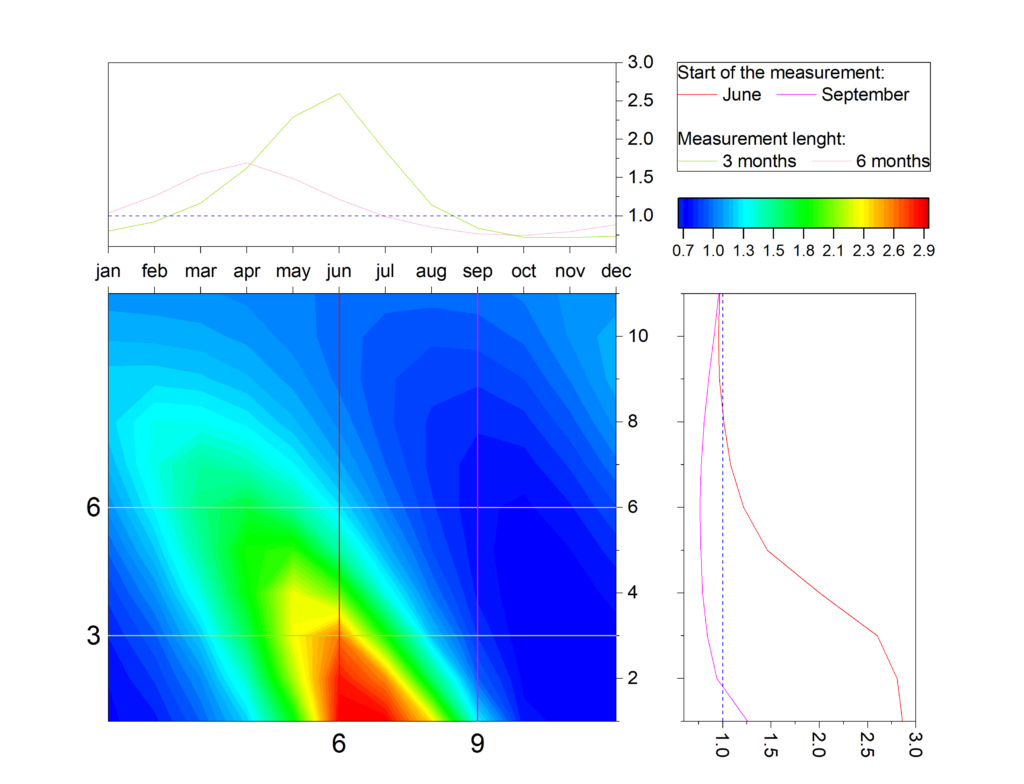
By utilizing the Uv correction factors determined through the MLI method, the action levels were applied to each location and estimation interval t. This allowed the assessment of the accuracy of the annual radon concentration. The model demonstrates good performance in situations where the average exceeds the reference value (300 Bq/m3). However, for values below this threshold, the accuracy is only above 60% for measurements taken over a period of 6 months or longer.

The results obtained are encouraging as they suggest the potential to shorten the measurement period from several months to just a few days. It should be noted that this increased accuracy is particularly evident in scenarios where the actual radon concentration exceeds the reference level. Future analyses will prioritize alternative methodologies, such as the Fourier transform and explore their potential combination to encompass a wide range of scenarios.

Results

1.1. The analysis of studies in the field was performed regarding the continuous measurement of radon concentration in the soil gas, respectively the determination of seasonal correction factors for estimating the annual radon concentration. The necessary documents for participation in the present study have been developed (Report on putting into operation the ICA device, Informed Consent regarding the processing of personal data, respectively a Collaboration Protocol between „Babeş-Bolyai” University and the host institution in the case of workplaces, respectively a Monitoring Convention in the case of the dwellings). The buildings participating in the study were also selected. Maintenance and hosting was provided for the mobile application that allows recording, visualization and storage of data obtained with the ICA device. An add-on was also used to automatically send messages about study status to the participants.

1.2. Optimizing the tools and methods of experimental evaluation, analysis
and control, an international calibration was made for the passive radon
measurement method by participating in an international
intercalibration exercise carried out by the Bundesamt fűr
Strahlenschutz (BfS) – Germany, after which a calibration certificate
was issued.

A calibration exercise was also carried out in the Radon
Testing Laboratory „Constantin Cosma” (LiRaCC), UBB, with the help of an
airtight enclosure, during which the radon sensors in the ICA devices,
respectively the CO2 sensors, were calibrated.

1.3. Adaptation of existing active devices for long-term continuous measurements of radon in soil gas, several experiments were performed to evaluate the precision and accuracy of the results provided by the Tesla sensor within the ICA device, respectively the Sarad RTM-1688 device for a wide range of radon concentrations in varying conditions of humidity and temperature. In this sense, the Durridge Rad7 device was used as a reference device, the experiments being carried out in the hermetic enclosure within the LiRaCC. The results highlighted the fact that the tested Sarad RTM device, although it is used in similar studies in the international literature, is not as accurate as the Tesla sensor, an aspect that leads us to carry out the continuous measurements of radon in the soil with this detector.

2.1. The maintenance of functionality for the ICA devices installed in the buildings selected in the first stage, as well as the platform that allows data recording and storage, were ensured in order to perform indoor physical parameters and radon measurements in seventy buildings (residential and workplace). Additionally, in accordance with the project proposal’s timeline, CR-39 type passive detectors were collected and replaced every three and six months, respectively, to assess the effect of seasonal variations on the correction factors. The preliminary results indicate a statistically significant difference between the radon concentrations depending on the purpose of the building.

An average value of 7% was obtained for the coefficient of variation at the level of pairs of CR-39 detectors, which suggests the accuracy of the method even at low values of the radon concentration. A very good correlation (r = 0.97, p < 0.001) was also obtained between the concentrations measured by the active method (ICA) and the passive method (CR-39).

As part of Activity 2.2 – Long-term measurements of radon in the indoor air, in the soil gas, respectively the exhalation rate, together with the physical and environmental parameters, the meteorological station was installed in order to monitor the outdoor air parameters (pressure, temperature, quantity of precipitation, wind direction and speed), as well as from the soil (temperature and humidity at various depths). In parallel, the rate of exhalation of radon from the soil was measured, as well as the radon in the soil, along with the indoor radon concentration using the ICA device.

The radon concentration showed a variation between 11.0 and 49.7 kBq/m3 with an arithmetic mean of 25.2 kBq/m3, a median of 24.8 kBq/m3 and a coefficient of variation of 29%.

A moderate correlation was obtained between the values determined for the rate of exhalation from the soil and the values measured for the concentration of radon in the soil (r = 0.79, p < 0.01).

In the analysis of radon measurements in correlation with environmental parameters, 12 predictors provided by the meteorological station and the dependent variable – the concentration of radon in the soil were taken into account. A regression model is built using the Keras library, designed as a feedforward neural network. The model comprises several layers with 2000 and 5000 nodes respectively and using the ReLU activation function.


The final layer consists of a single node that uses a linear activation function. This model is compiled with the Adam optimizer and uses the mean squared error (MSE) as the loss function. Using this setup, the model is trained on the dataset by dividing it into batches of size equal to 100, applying 500 iterations. After calibrating the model, its performance is evaluated on test data. Indicators obtained when evaluating the performance of the model, such as the coefficient of determination (R2 = 0.96), the Mean Absolute Error (MAE = 834.4) and the Root Mean Square (RMSE = 1338.6), are calculated and displayed. The comparison on the test data between the prediction provided by the model and the measured data is indicated in the figure below.

In Activity 2.3 – Time series analysis for continuous measurements of radon in soil gas to identify cyclic variations and remove the background noise induced by these variations and to automatically detect anomalies several anomaly detection techniques were applied starting from to the standard deviation from the mean or the density-based clustering algorithm (DBSCAN) and to unsupervised learning methods based on neural networks (Autoencoders). The method of autoencoders takes into account the local context and the history of values in determining anomalies, while the statistical method with parameters calculated at month level, takes into account the exceeding of a threshold value calculated for that month, while the DBSCAN algorithm performs a linear separation of the data normal from abnormal ones, at the level of the entire study period.

The figure below displays a comparative analysis of the outcomes of applying the algorithm of the LSTM autoencoder method (top), the DBSCAN aglorithm (center), and the statistical method (µ+3σ) with parameters calculated at the monthly level (bottom) in the detection of radon concentration anomalies.


Dissemination:

The preliminary results regarding the radon exhalation rate from soil were presented during the Environment & Progress Symposium „Sustainable development: approaches and solutions for resilient communities”, Cluj-Napoca (May 18-19, 2023). The method of measuring radon in the soil depending on the number of measurement points was published in Atmosphere 14, 713 (2023) – Determining the geogenic radon potential in different layouts and numbers of points.

The results obtained regarding the detection of anomalies were published in the dissertation thesis „Analysis of time series in order to identify anomalies in the variation of radon concentration”, supported by Grecu Şerban, member of the research team. Also, the results were disseminated in the form of oral presentation (Anomaly detection using time series analysis in the variation of radon concentration) within the 16th international workshop „Geological aspects of radon risk mapping” organized in Prague (19 – September 21, 2023), respectively within the Environment & Progress symposium.

The impact of the factors on the indoor radon concentration was evaluated by several techniques from univariate statistics to machine learning. The results were capitalized by publication in the journal Science of the Total Environment 905 (2023) – Exploring statistical and machine learning techniques to identify factors influencing indoor radon concentration. These results were also disseminated in the Prague Workshop through the oral presentation „Factors affecting residential radon concentration in Romania”, respectively in the Environment & Progress symposium (Inferential statistics and automatic learning in the assessment of the impact of influencing factors on radon concentration residential).

The monitoring of the radon concentration in residential buildings and those with workplaces, through the passive and active method, allowed the calculation of temporal correction factors depending on the method and the type of building. The obtained results were sent for publication in the journal Heliyon.